Key facts and figures
Approximately 25,000 employees
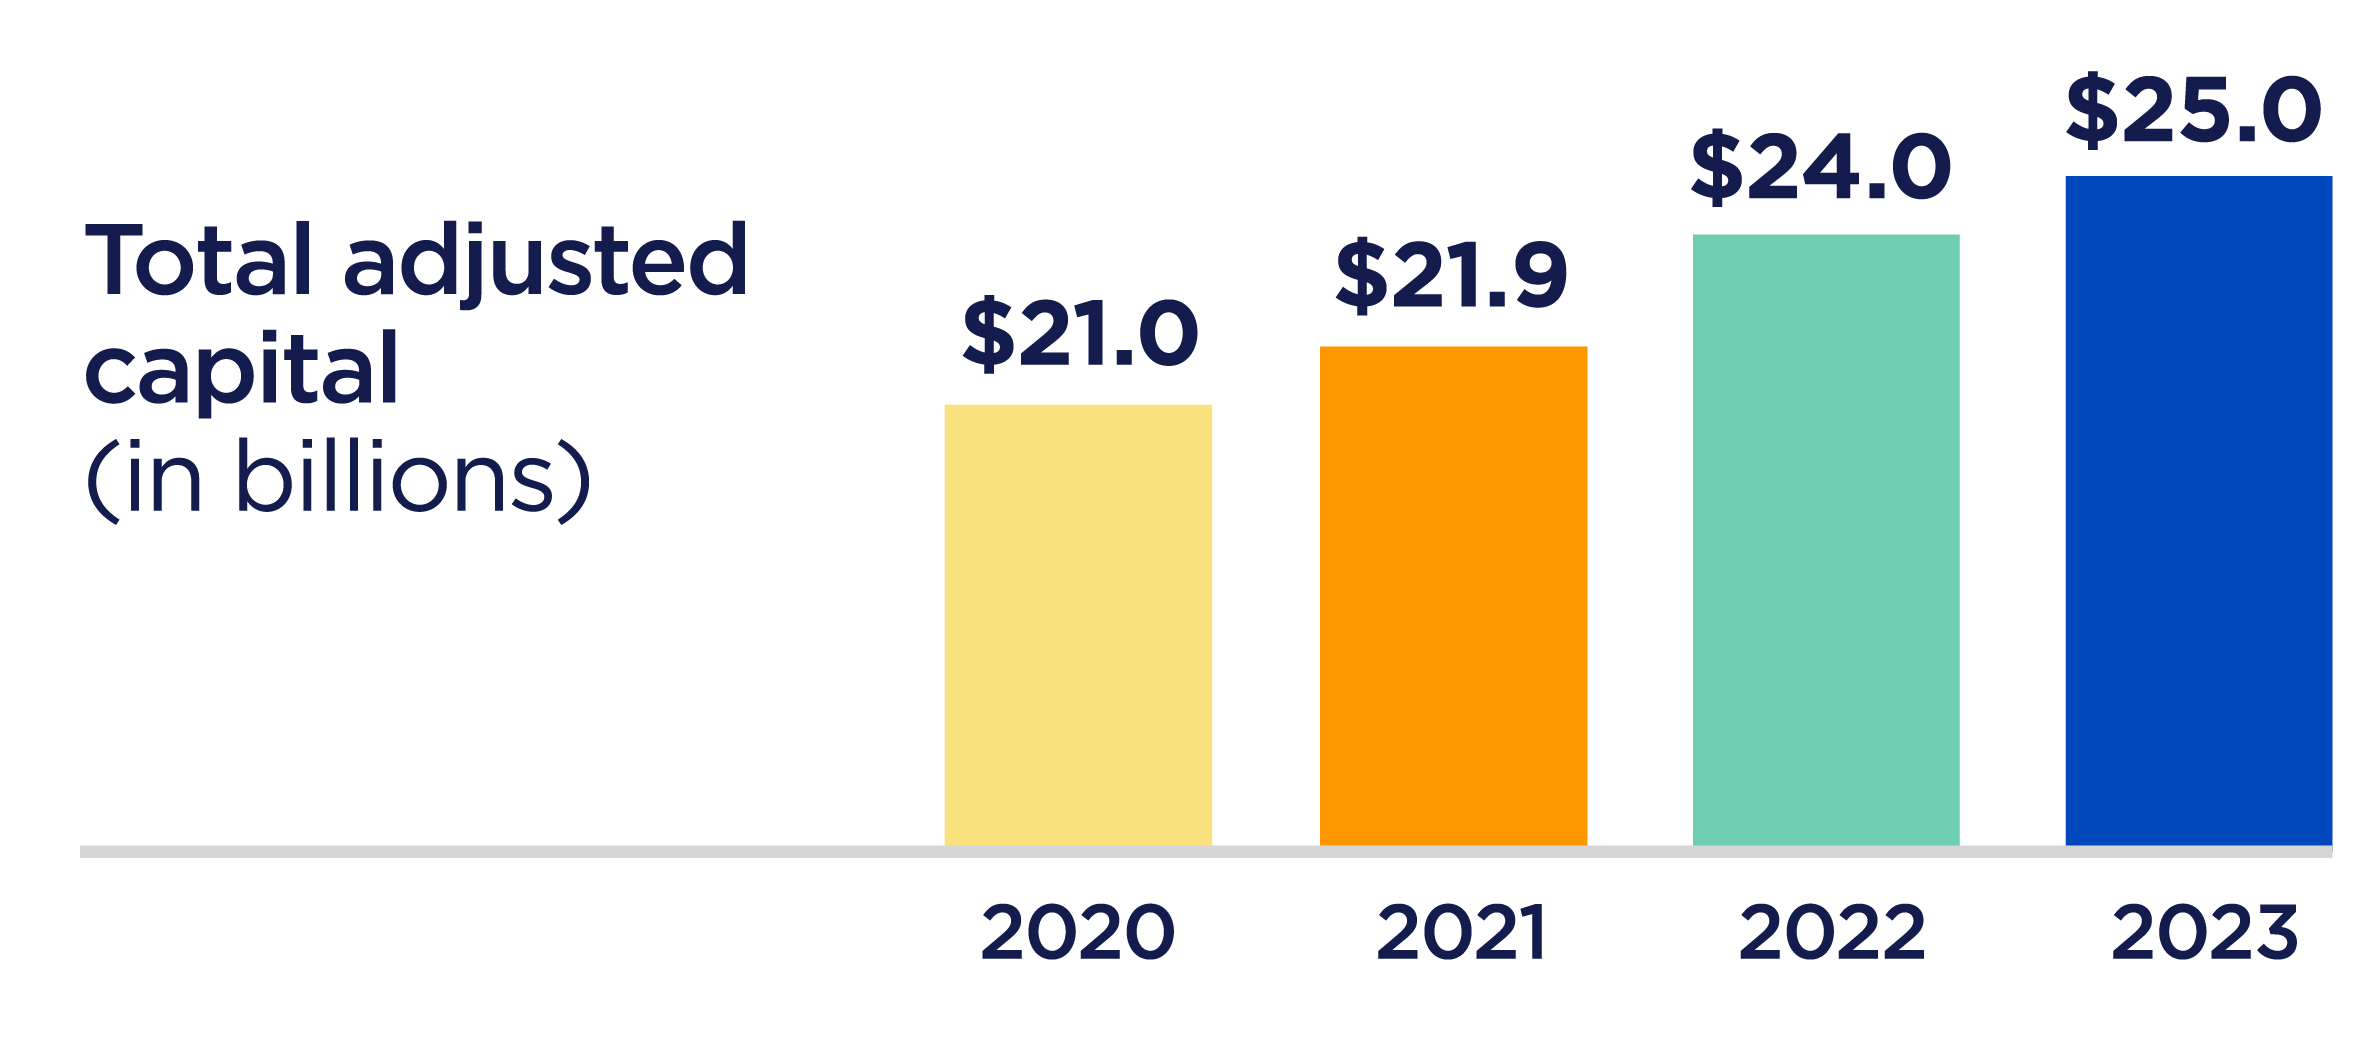
Capital strength
Nationwide's capital position is strong, enabling us to continue to serve you and evolve our company well into the future.
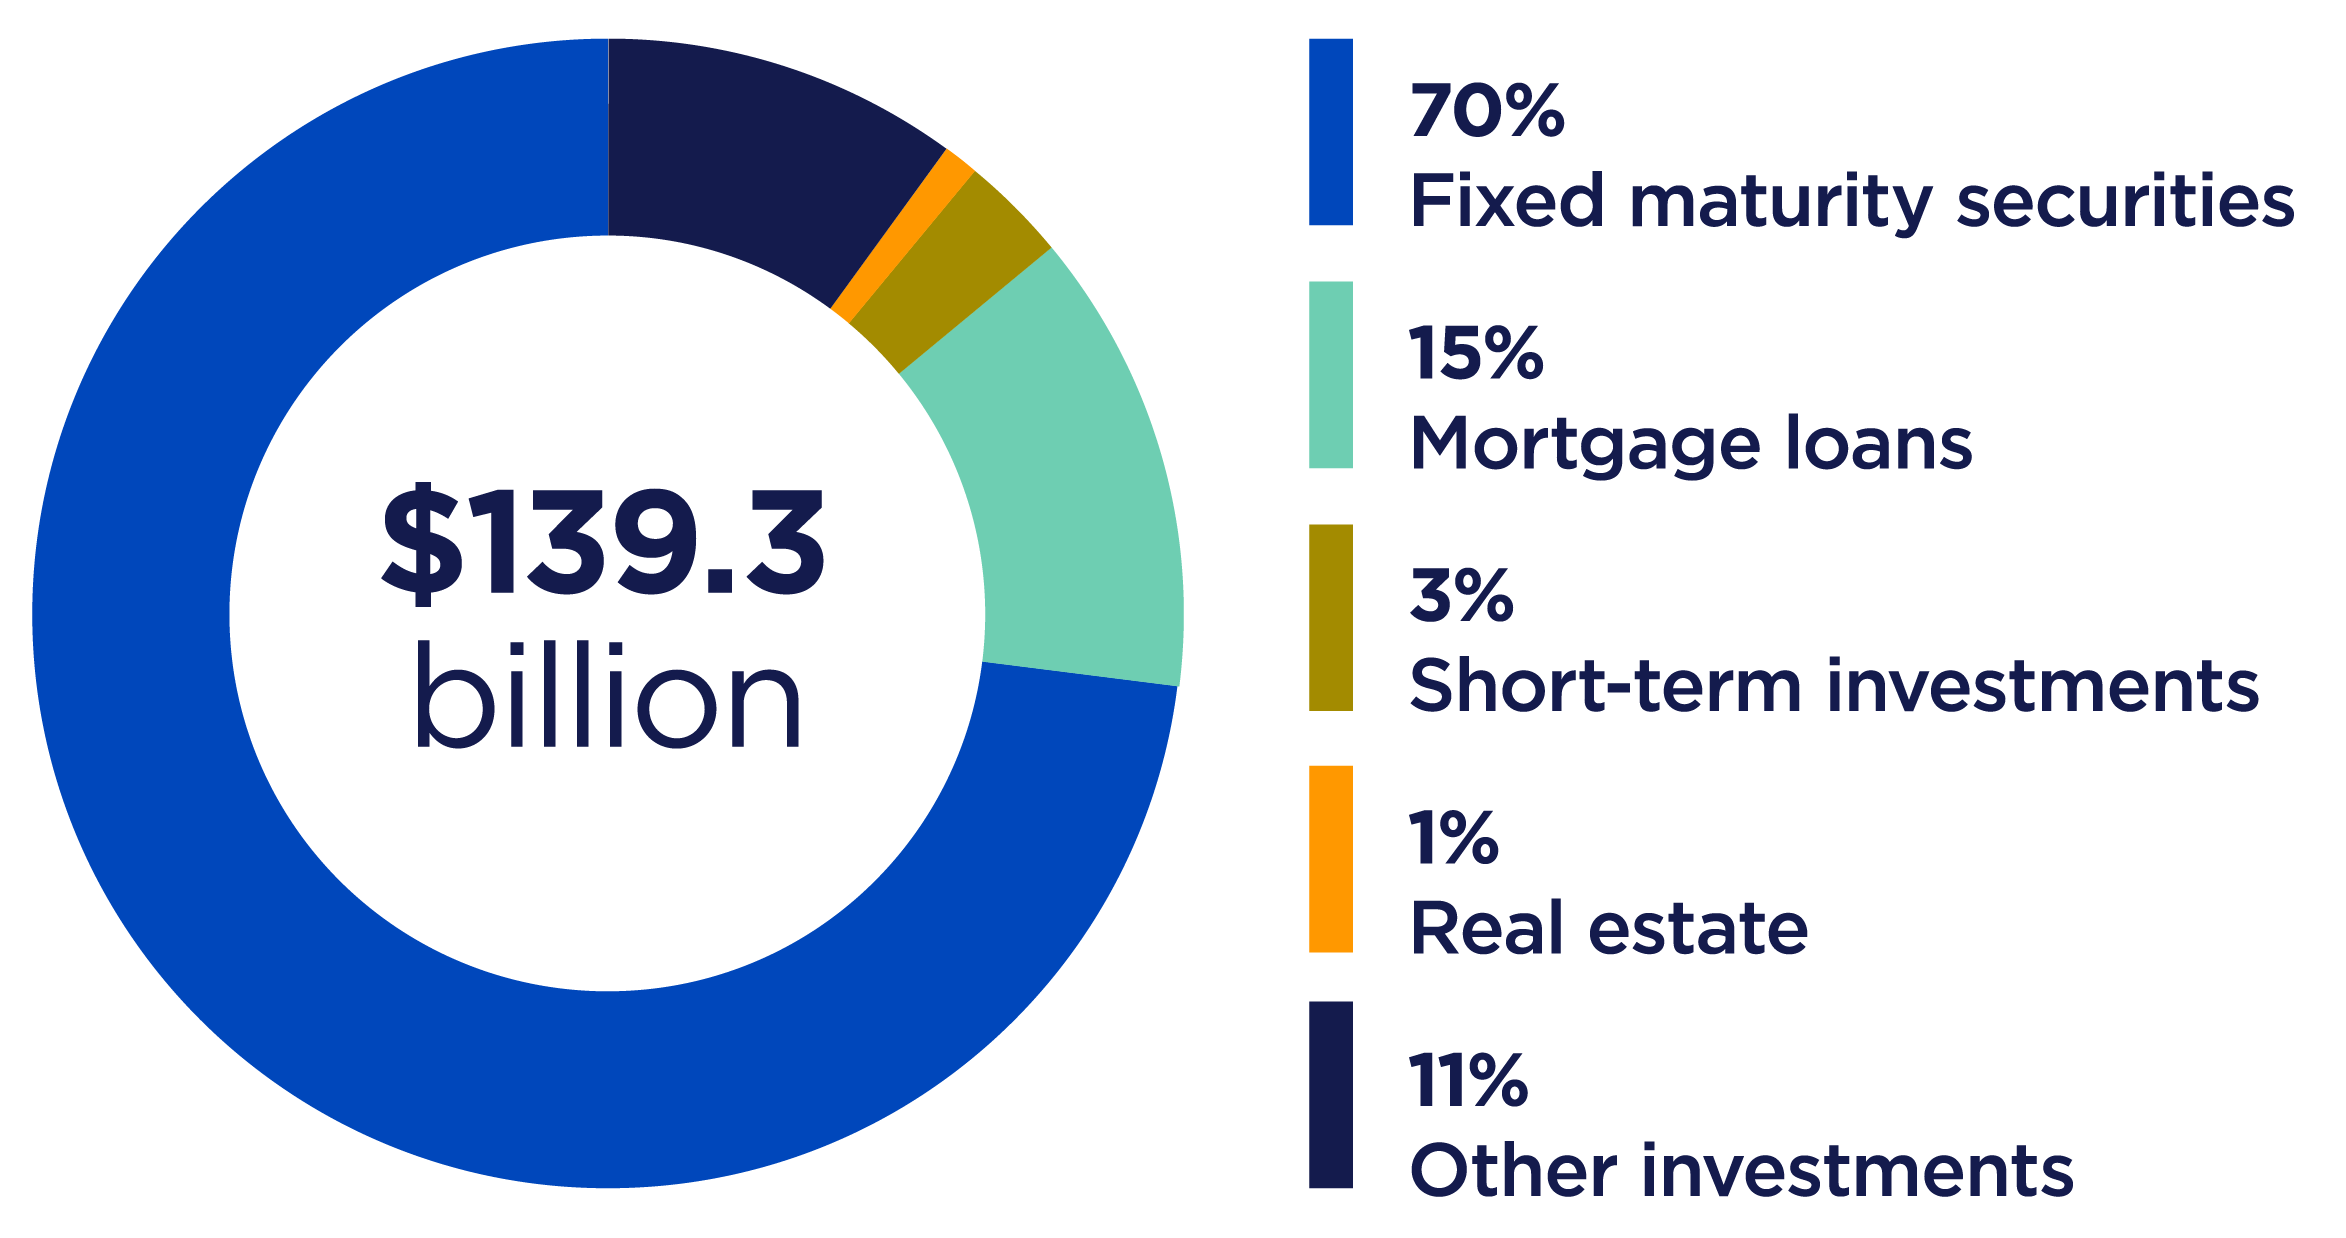
Investments
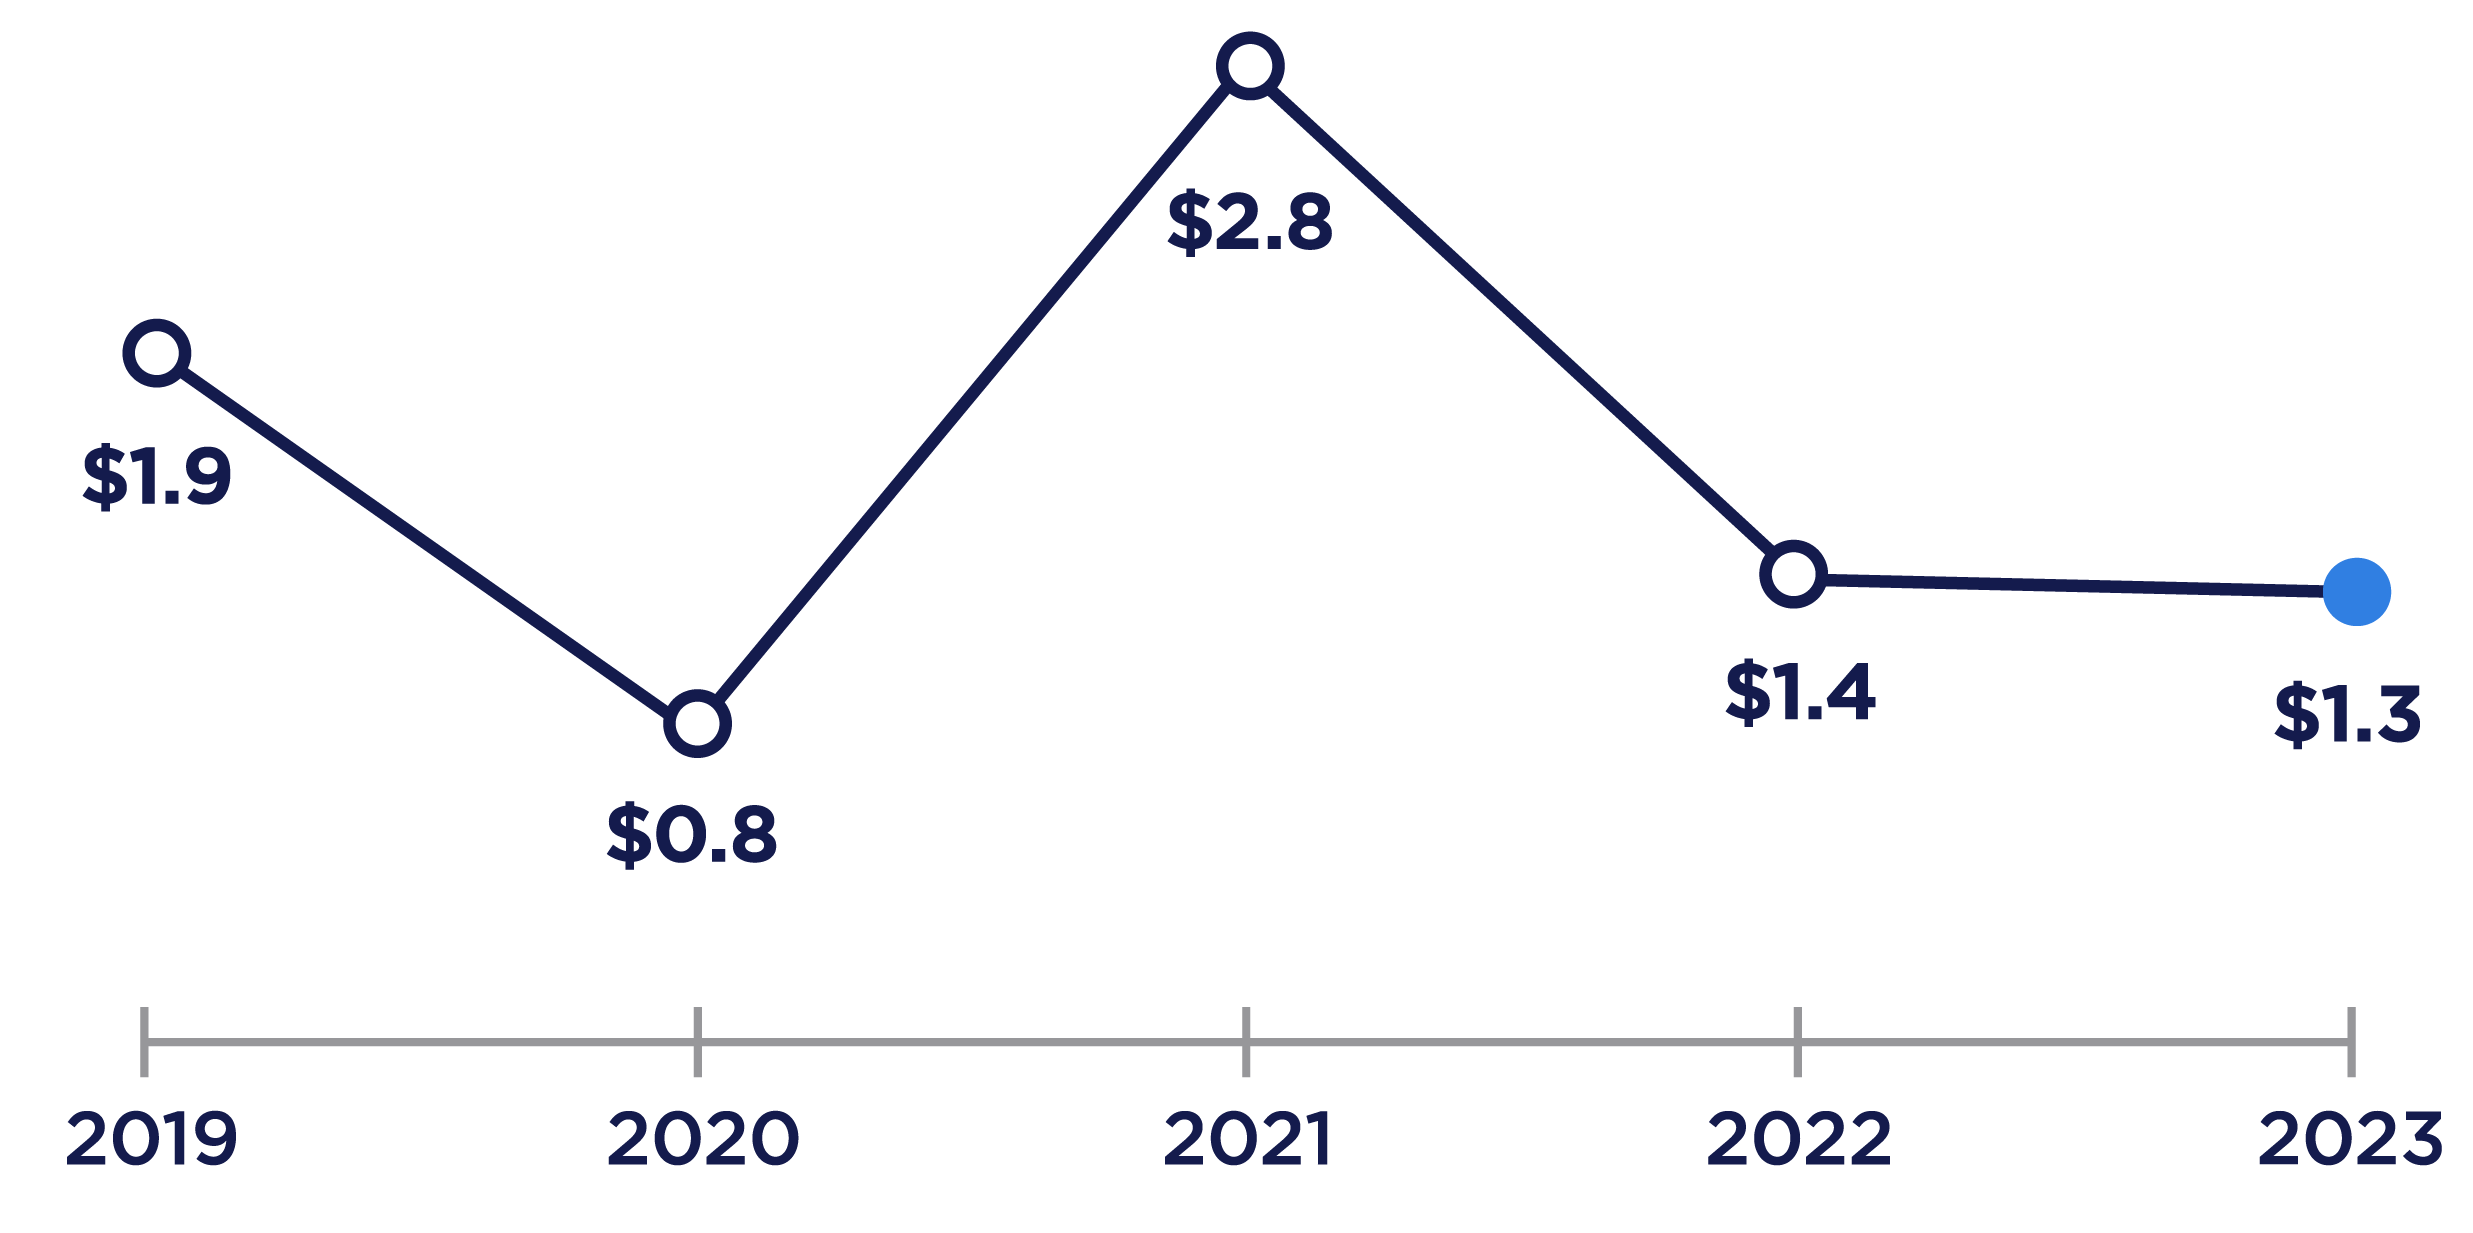
In 2023, total investments ended at $139.3 billion. Net operating income of $1.3 billion.
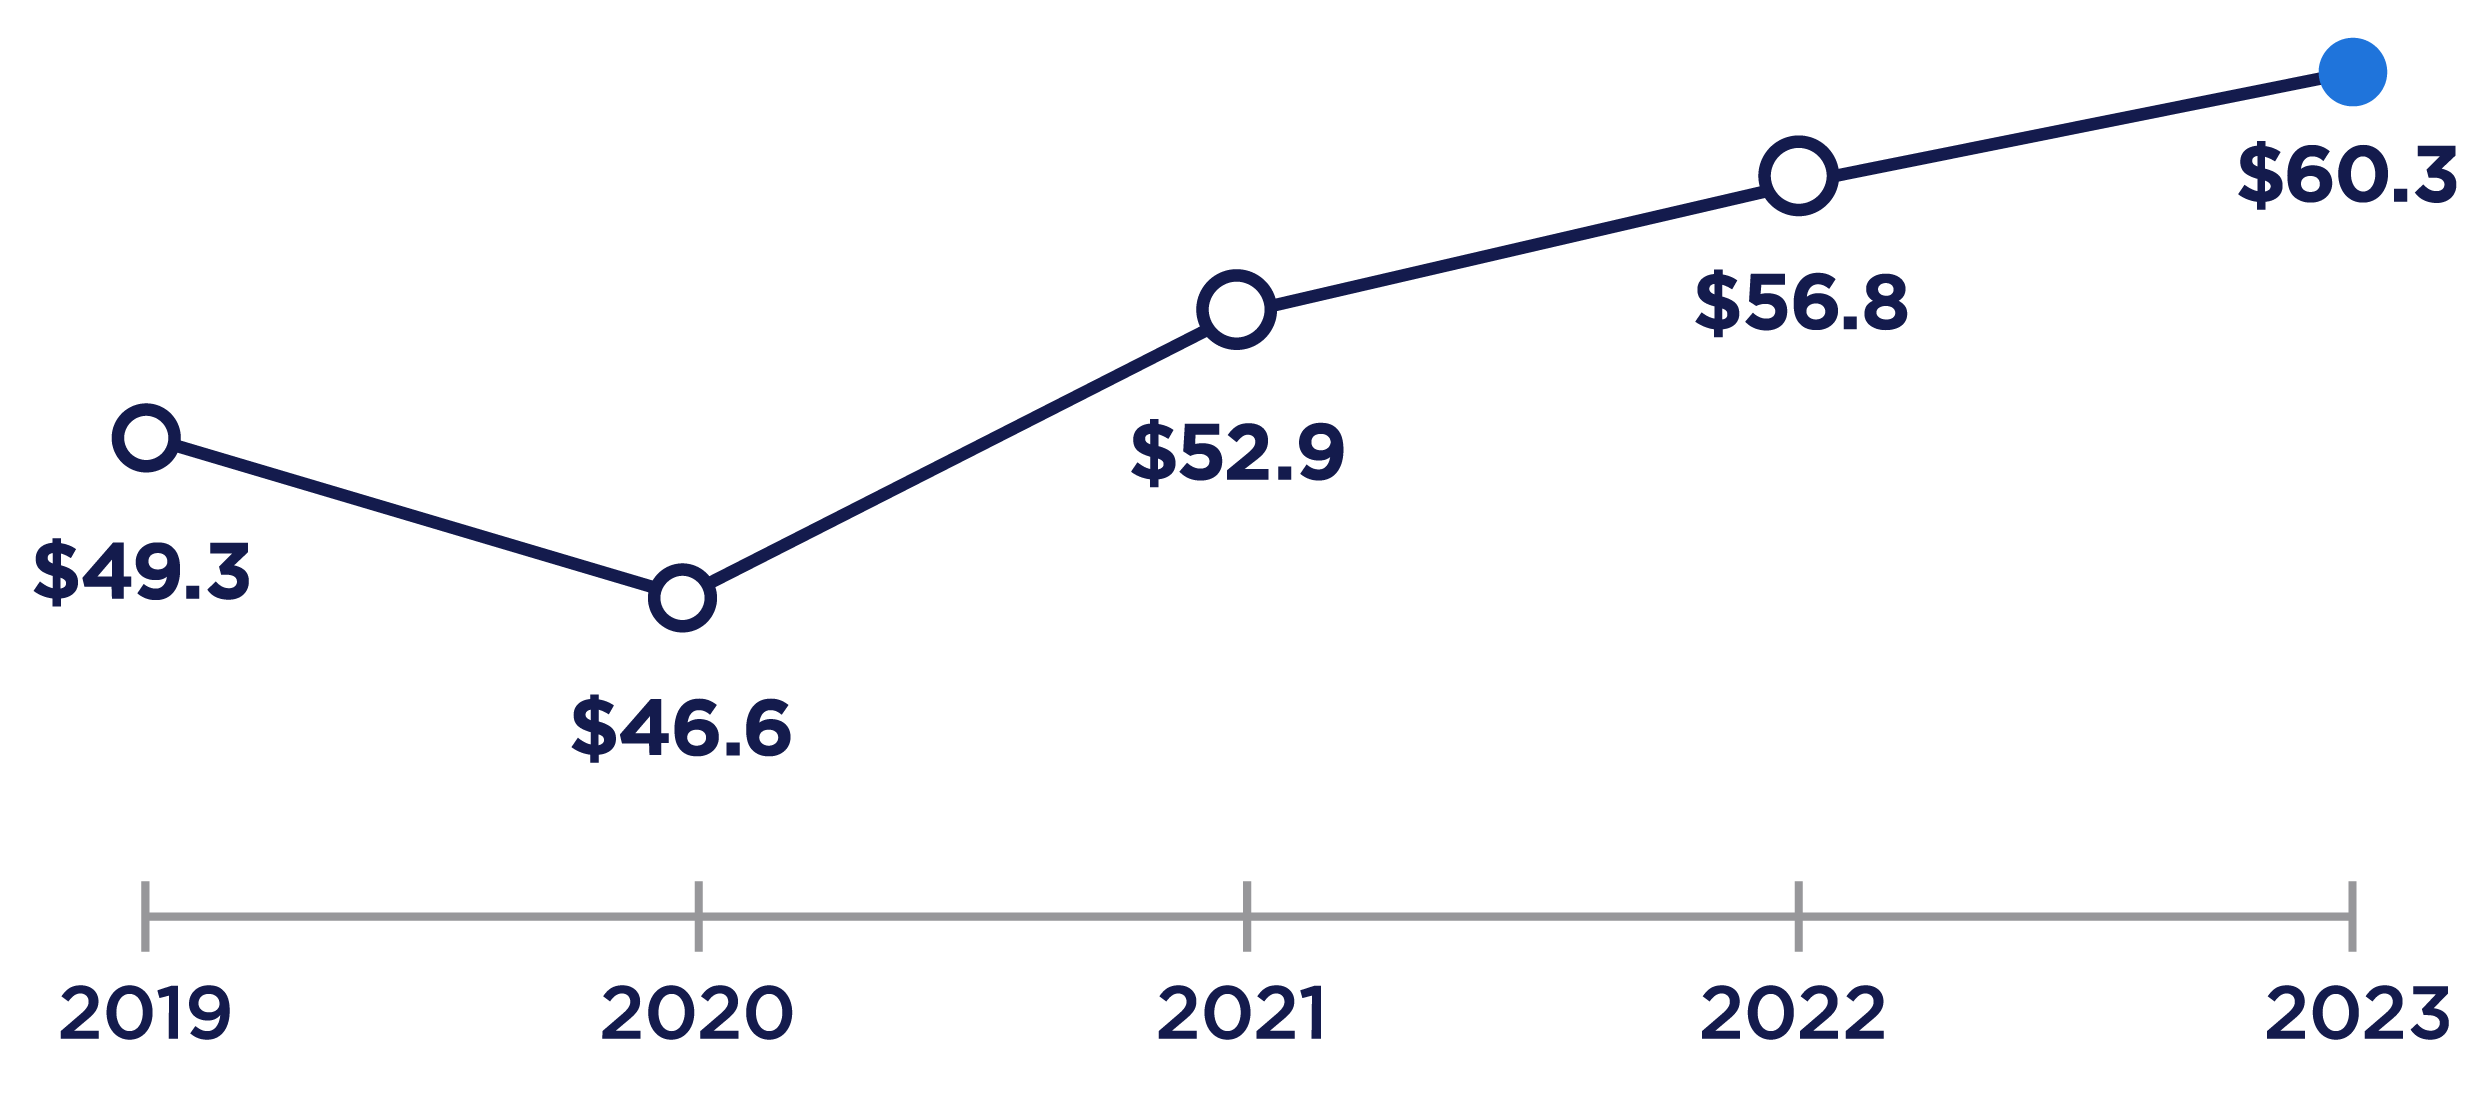
Total sales in 2023
$60.3 billion
Net operating income
$1.3 billion
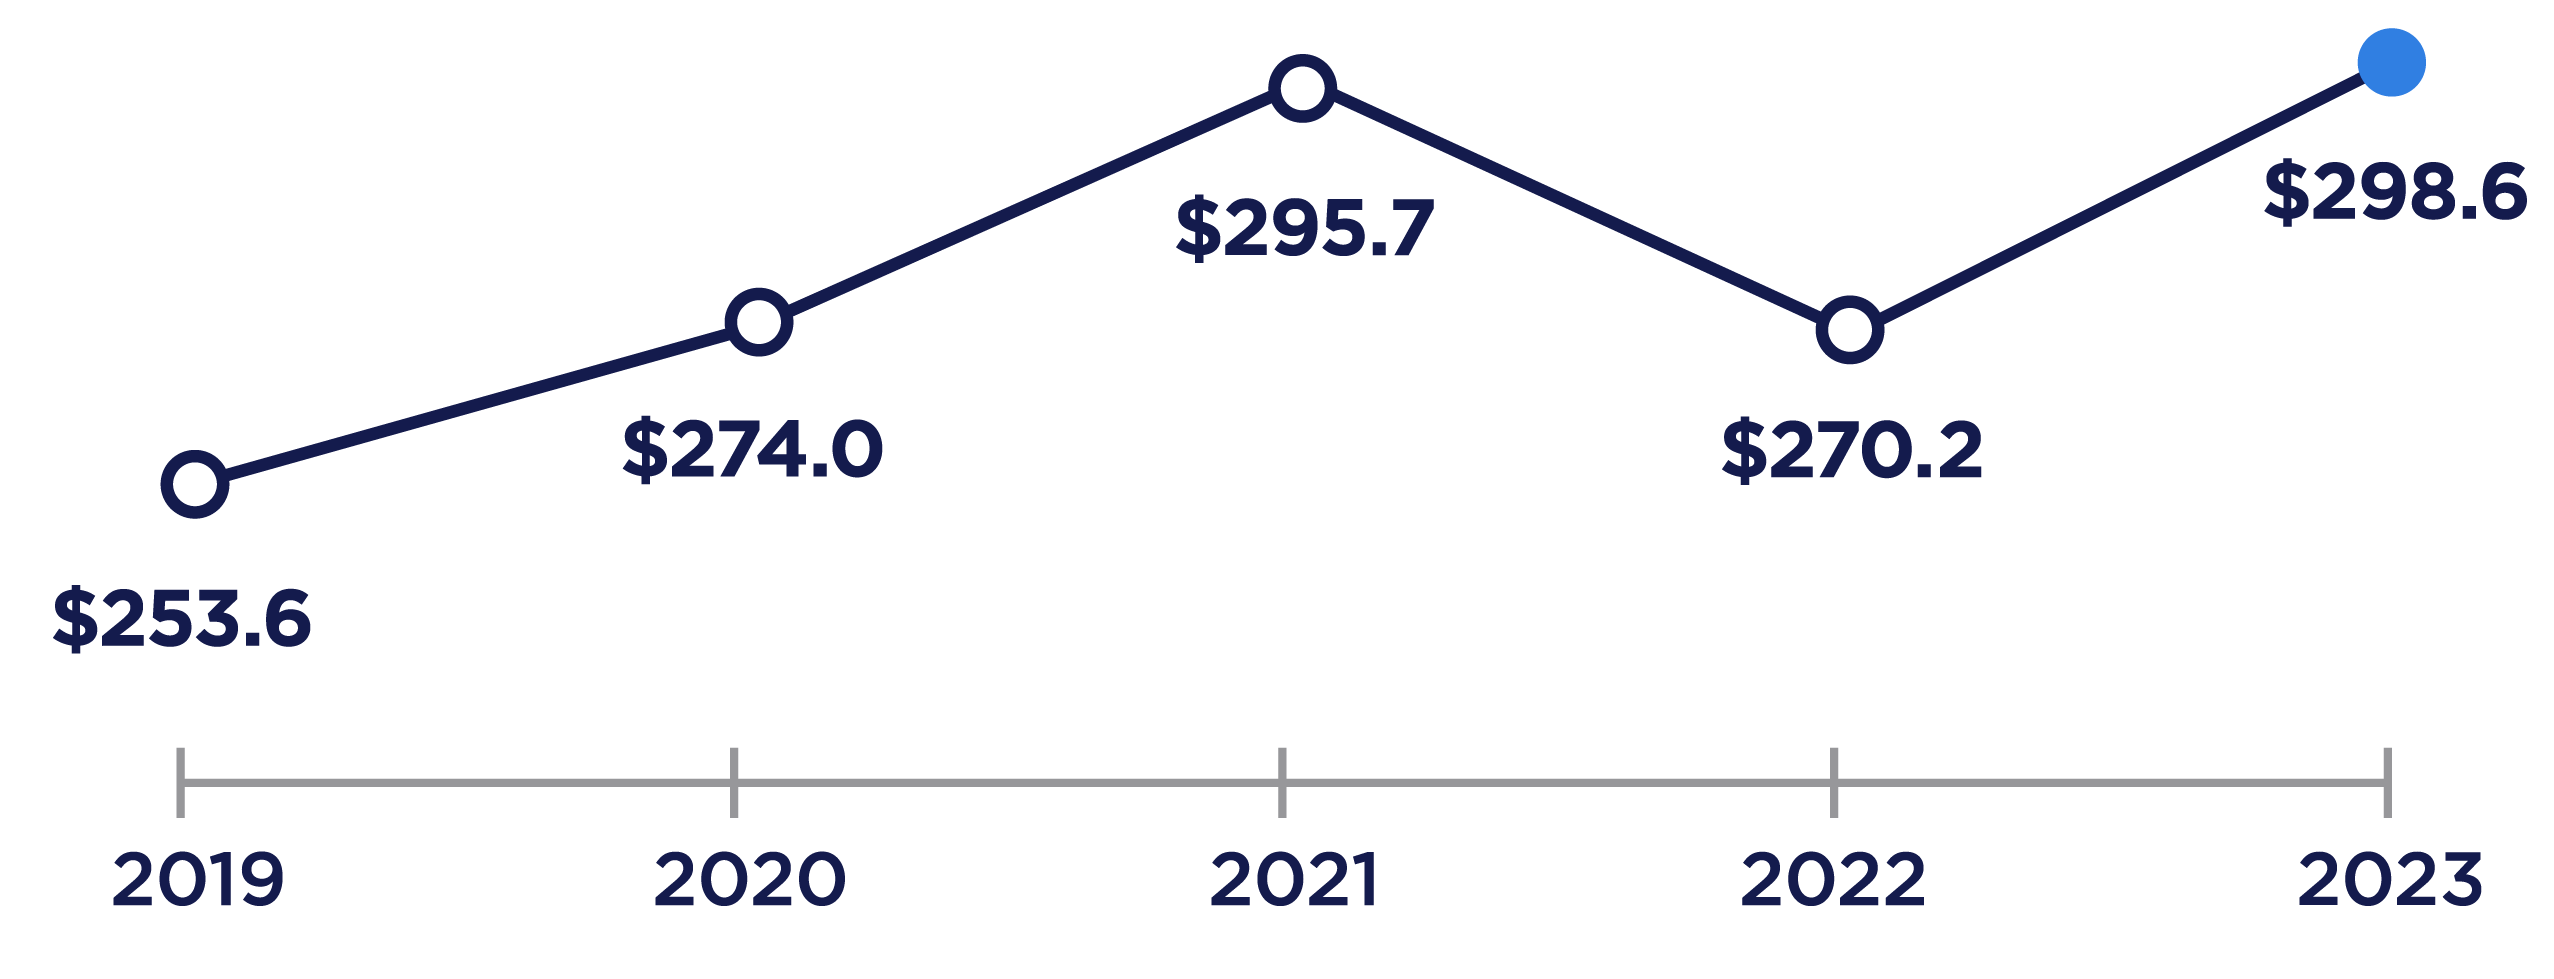
Total assets
$298.6 billion